
I’m a Web Developer based in Adelaide, Australia. Even though I have a Telecommunications Engineering degree and an MBA, coding is my passion and my new professional career focus. Developing applications for the web has become my drive.
Introduction
Since I started working as a software developer, I find myself spending the majority of the day debugging a big react app. This is not the result of a poorly implemented code, but what I feel is the natural process in which I find myself involved daily:
- I can debug to find the root cause of an actual bug
- Or I can debug as part of the normal development process (most likely)

When hunting for actual bugs in the code, we need to focus on tools and systematic processes to analyse the code in search of what's not working and accept the fact that the person that wrote the code may not be available to answer our questions. Sometimes, though, the bug might have been introduced by ourselves 🙋♂️, and we can find it difficult to step in the shoes of our past selves in order to understand why we did what we did. No matter what's the case, they all have something in common: we need to use tools to help us debug the app and find what's wrong with it.
More often than not, I feel debugging is not solving a particular issue affecting a customer, but the natural process inherent to the development of software. If I want to create a feature for an existing app (or build one from scratch), I will often face code that is not working as it is supposed to 🤷♂️, and here is when I will pull out the "debugging arsenal" to find out what's wrong with the code in order to keep moving forward in the development process.
A special note: when a bug is introduced by ourselves
Let's apply some logic here: 🤔 if we have created a bug, then we are not in the position to be able to solve it, because if we could, we wouldn't have created it in the first place! This is why we need additional tools that can help us to step outside ourselves in the process of finding a bug, just like if we were detectives trying to solve a crime in which we are the prime suspect. We need to be methodical, go step by step, test a lot, and gather evidence. Here is where debugging tools come to our rescue.
Breakpoints and the debugger
When debugging a React app, I often find breakpoints to be very helpful. There are two main ways in which we can use them:
- By writing the
debuggerstatement in our source code - By clicking on a specific line of the code in the Chrome web browser (or Firefox, Edge, etc.) Developer Tools.
Using the debugger statement
The debugger statement invokes any available debugging functionality, such as setting a breakpoint. If no debugging functionality is available, this statement has no effect. - Source
Let's say we have a project in which we are interested in finding out what's happening in a particular section of code. In this example, I'm using the source code of my portfolio site, which you can find in this GitHub repository). I have introduced a bug, and now I will search for it using the debugger.
In this particular bug, the third animation related to the portfolio title is not working correctly, so I can write the debugger statement in that section of the code.
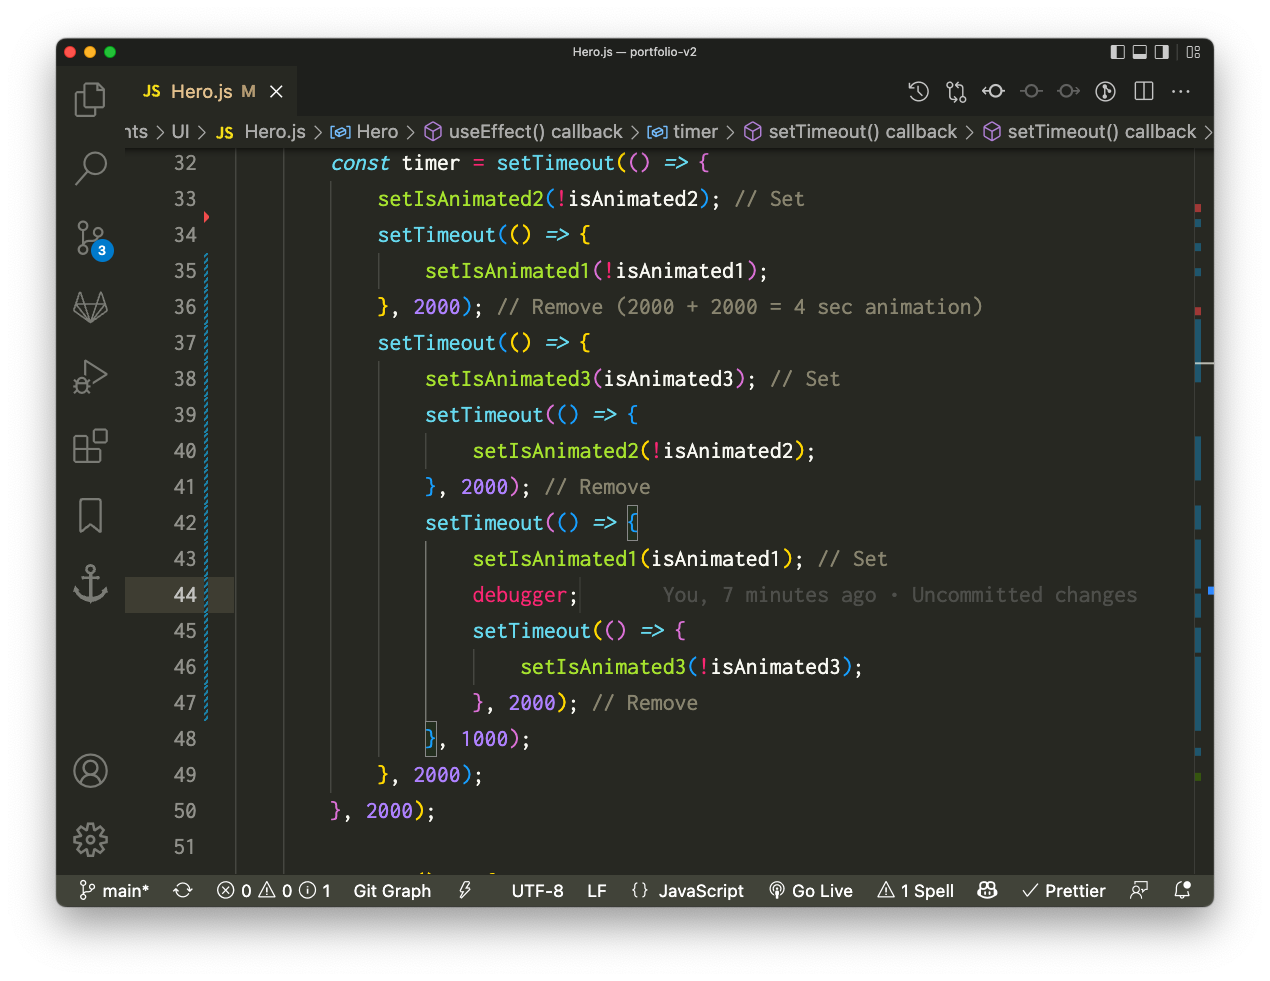
Once the file is saved and compiled, as soon as I reload the page and the browser parses that code, it will stop on the line that has the debugger statement on it. The browser will then display useful data in the Developer Tools pane.
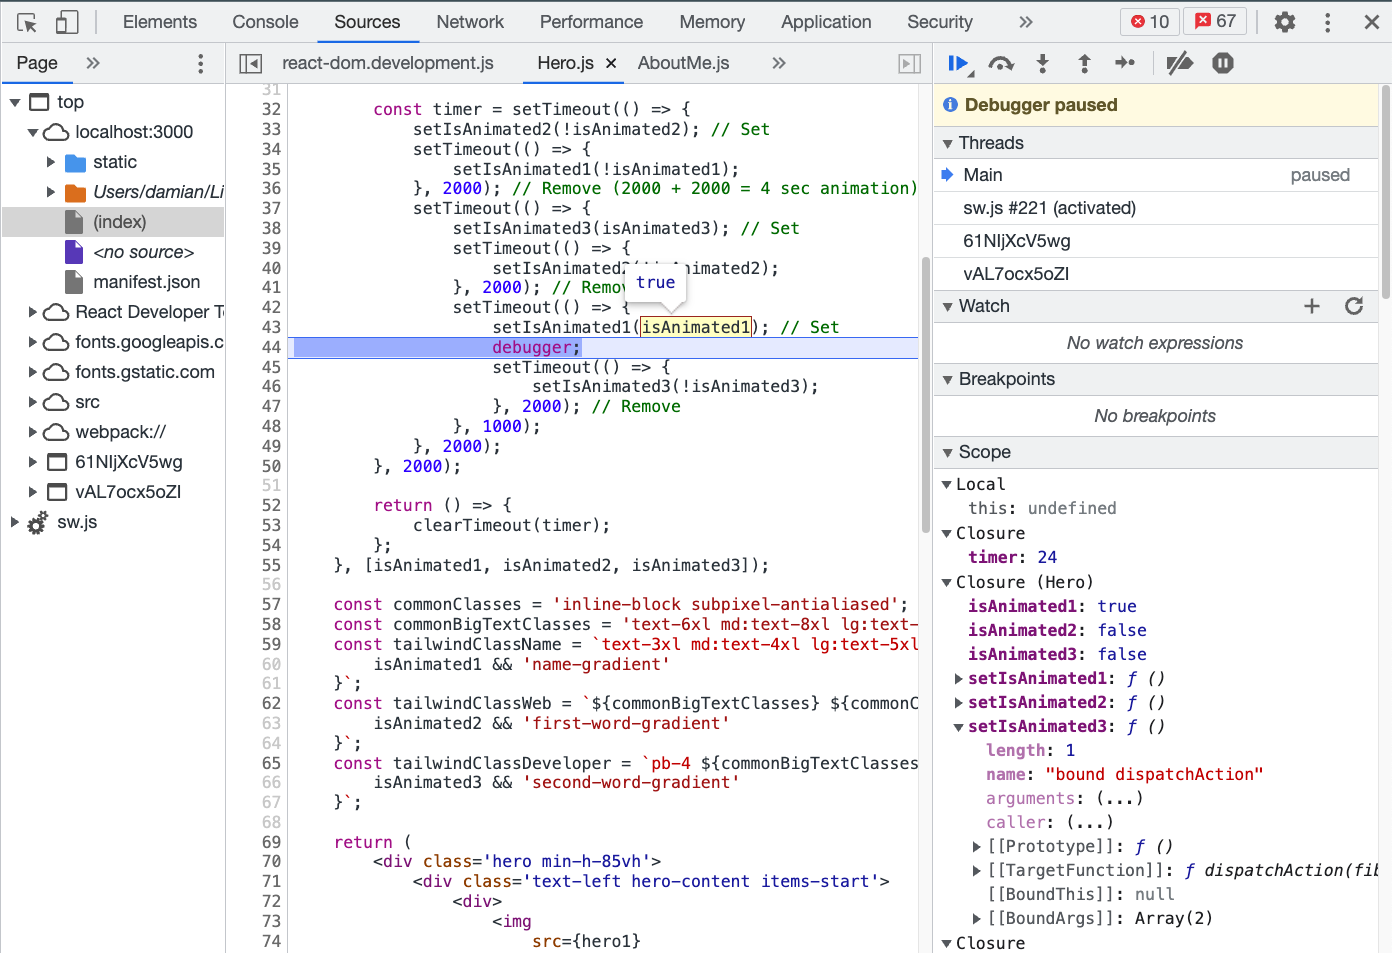
We can see the value of variables at that moment by hovering over them in the source code, or in the panel located on the right, in the Scope section. Thanks to this, I can see that the value of the setIsAnimated1 function is being called with the wrong value.
Using breakpoints
Breakpoints work in a very similar way. To enable breakpoints we need to open our site in a web browser (I'm using Chrome in this case) and open the Developer Tools. Now, if we click in the Sources tab and in the tab with the file name that we are interested in debugging, we will see our source code once more, as happened in the previous method using debugger.
Note: for more information about the Developer Tools' Source tab, read this article.
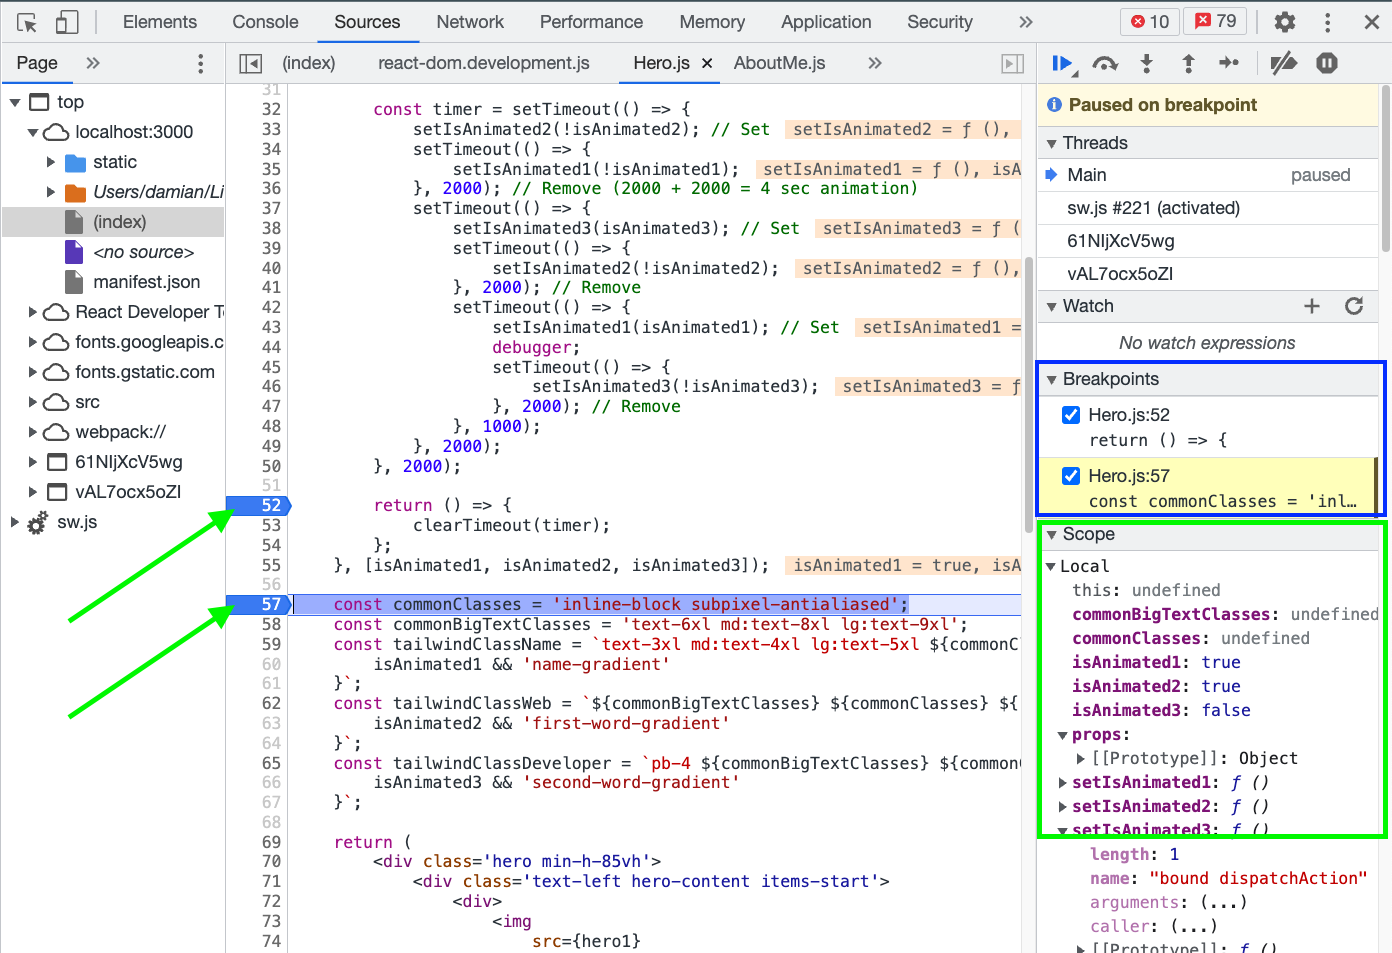
Now, in order to create a breakpoint, we can click on the margin just next to the line number. These breakpoints will be listed in the panel shown on the right, in the Breakpoints section. We can now reload the page, and the loading of it will stop at the breakpoints we have set (we can click the play button to tell the browser that it should continue executing the code and, thus, loading the page).
If you want to learn more about this topic, and even set conditional breakpoints or stop the code execution when a node is removed, for example, I think you should read the Pause your code with breakpoints article.
React Developer Tools
The previous debugging tools apply not only to React apps but to any JavaScript app. But, when working with React apps in specific, we have a very useful tool: the React Developer Tools browser extension. You can find this extension by searching for it on the corresponding browser extension marketplace. For example, for Chrome, you can install it from this link.
The react Developer Tools is a set of two main tools:
- the Components tool, where you can analyse the structure of the components,
- and the Profiler tool, where you can see the time each component took to render and how they are updated.
The Components tab
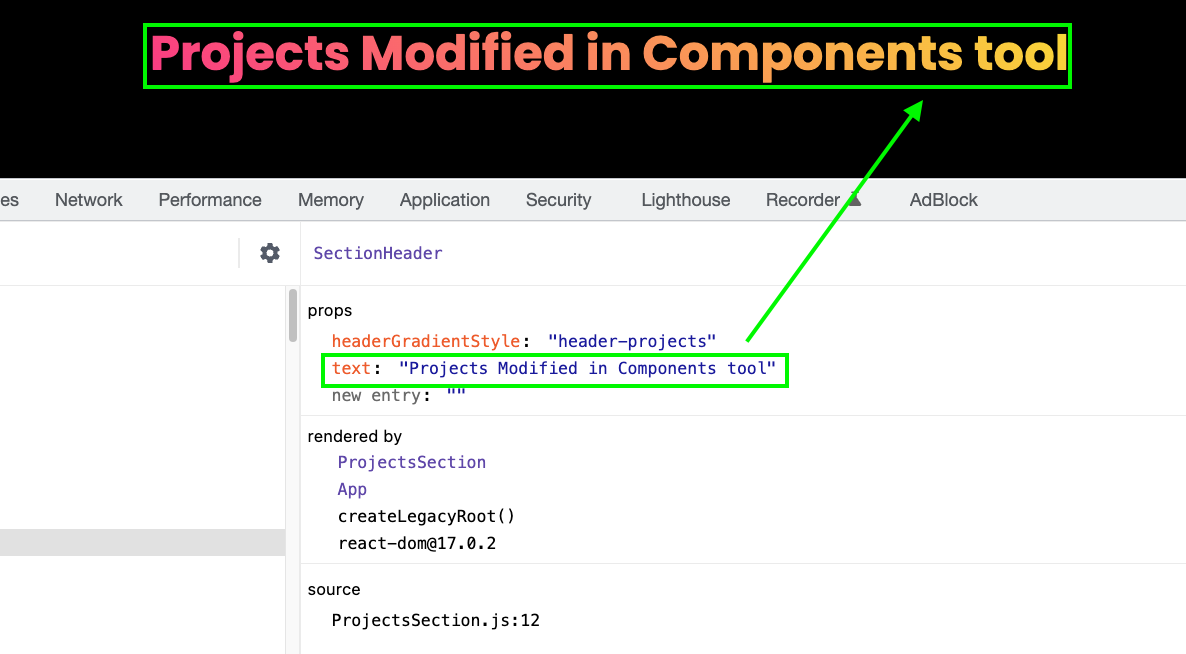
In the Components tab, you will be able to see the component structure of the site you are analysing (left panel), as well as the props, hooks (for function components) or state (for class components) that a selected component has (right panel), together with a list of the ancestors that ended up rendering the component you have selected.
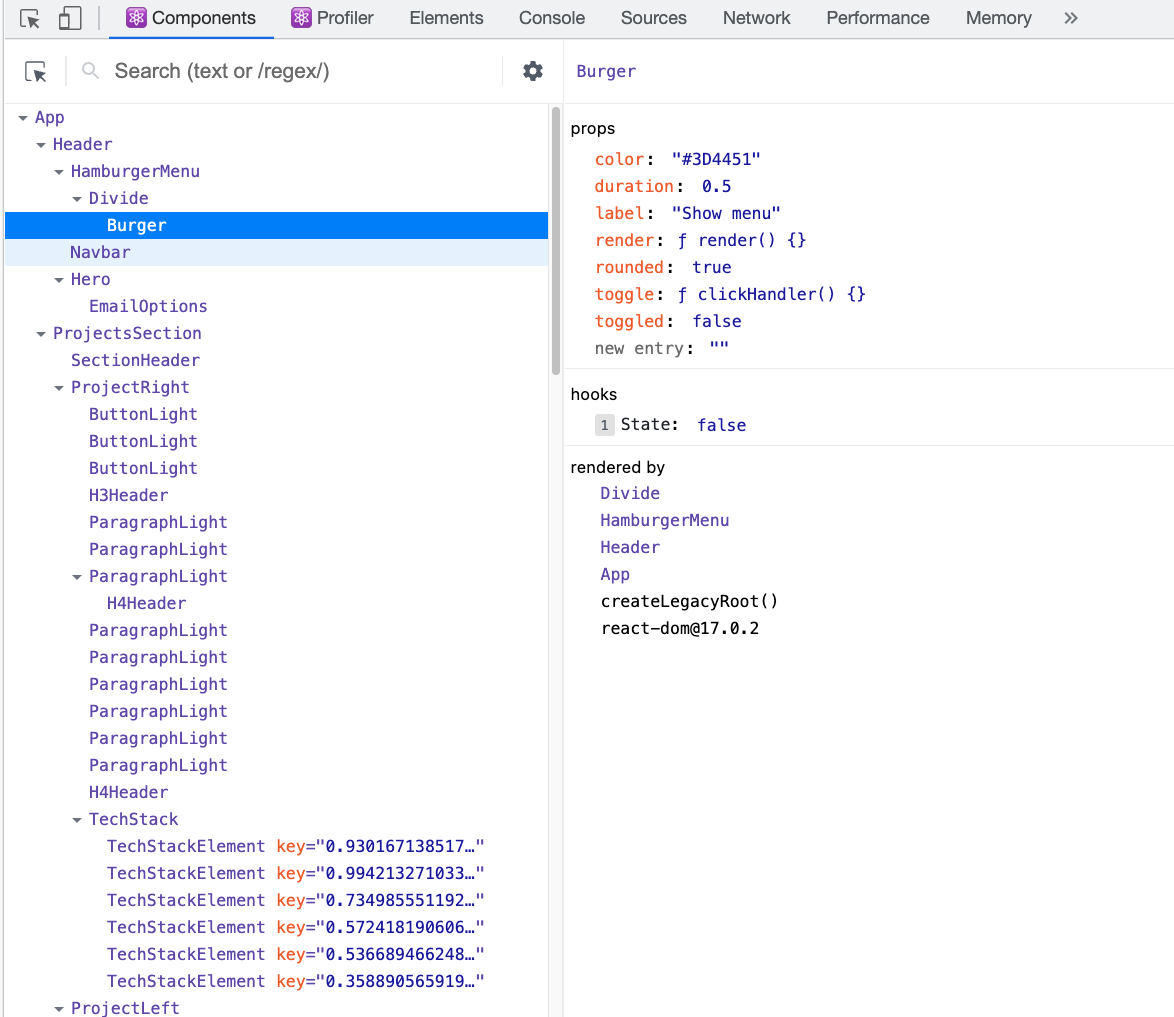
Just by the information this tool is presenting I think it's very valuable, but that's not all! You can also modify the props and hooks of the component you have selected, and this will affect the site in real-time, something that's very useful for debugging purposes. 🤯
The Profiler tab
As mentioned earlier, we can use the Profiler to record the time it took each component to be rendered. In order to do so, we need to click the Start profiling or Reload and start profiling buttons.
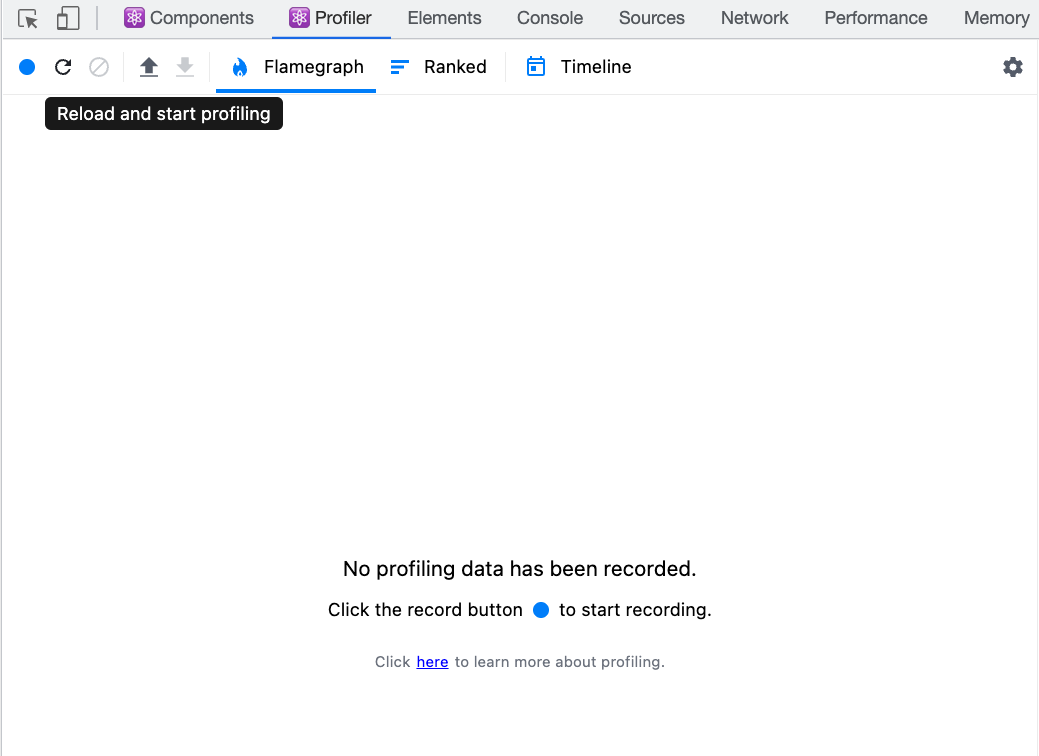
Once the site has been rendered, we'll need to click the Stop profiling button, and we will see a graph detailing the time each of the components took to be rendered. Instead of clicking on the Stop profiling button, we can interact with the site, clicking on buttons, menus, etc., and the profiler will record these interactions at a component level.
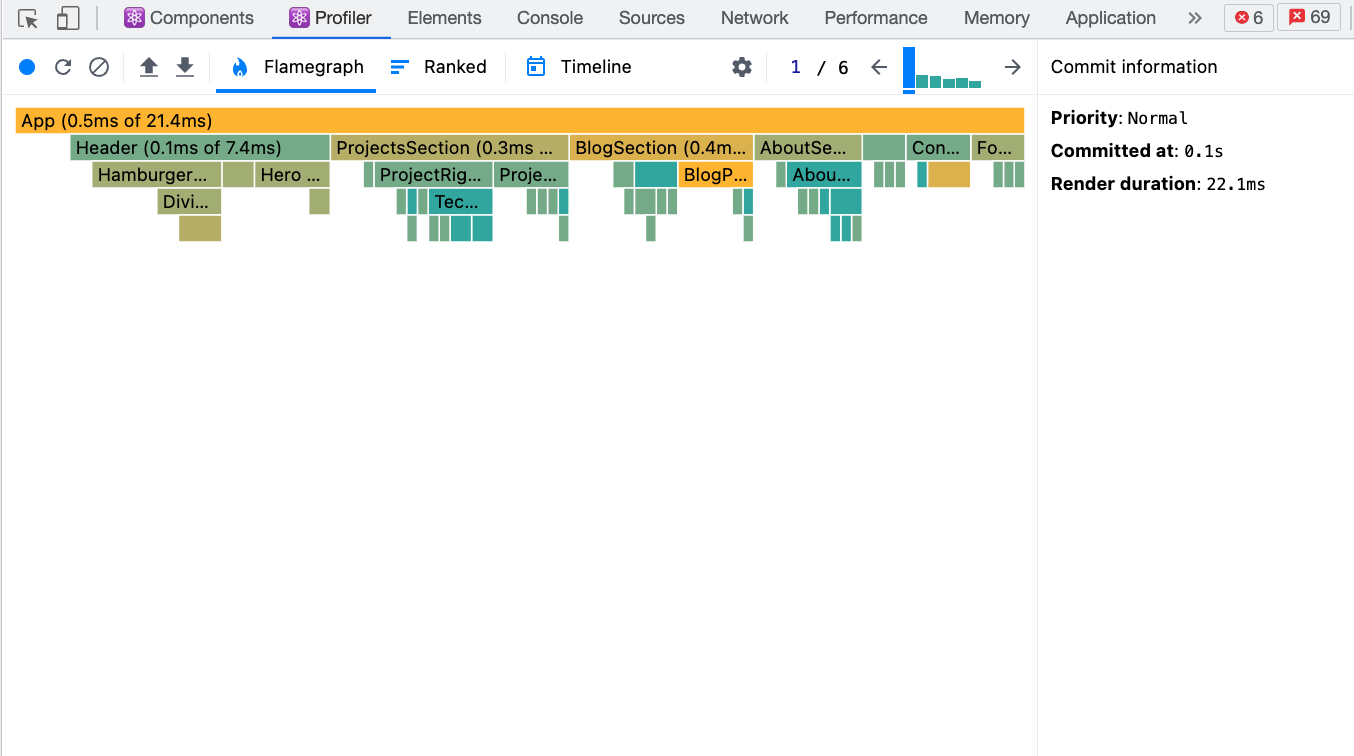
This is very helpful when we need to debug certain interactions with our app.
Bonus: check why a component was rendered
If we are interested in knowing why a particular component was rendered, we can activate this feature by clicking on the gear icon, then in the Profiler tab, and finally ticking the Record why each component rendered while profiling. checkbox.
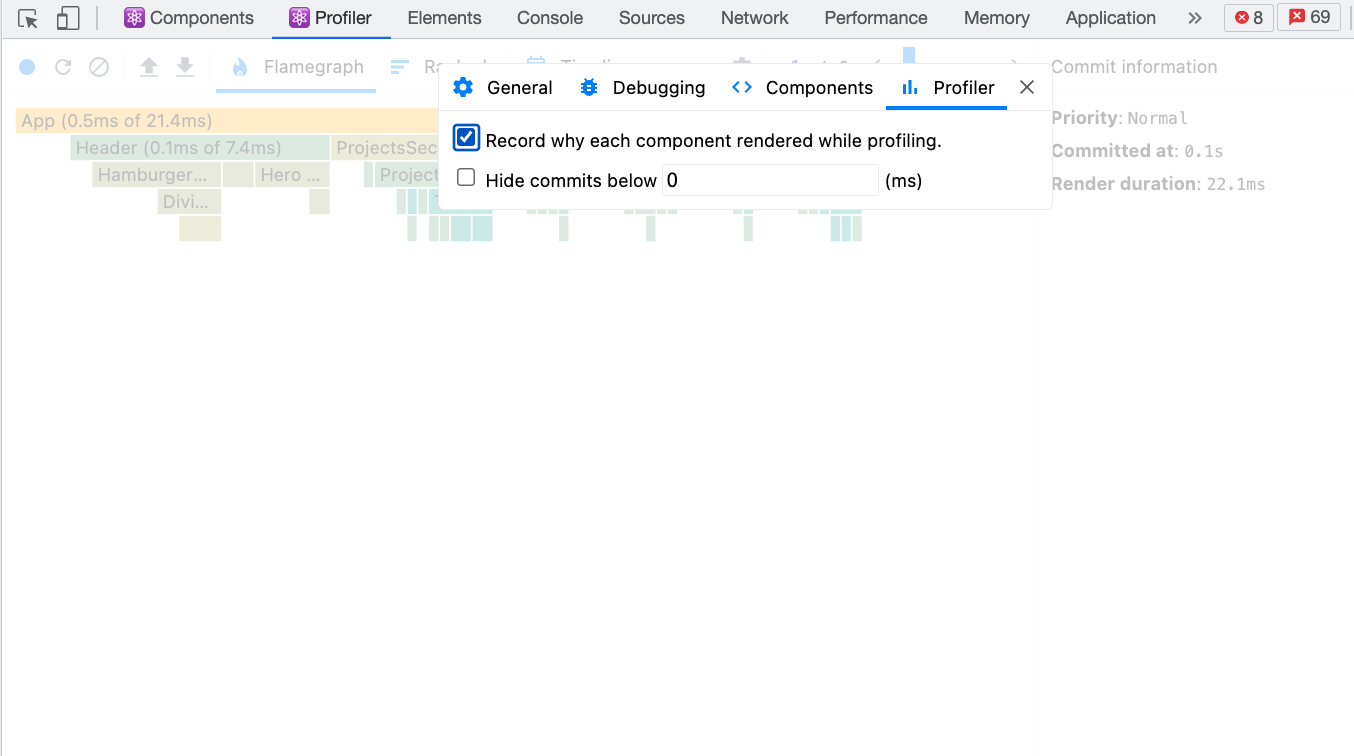
Now we need to start a new profiling, just as before, and we'll be able to see extra information concerning the reasons why a component was rendered. Some of the most common reasons for a component to (re)render are, as you can see by using this tool:
- the parent component was rendered
- its
propschanged - its state-related
hookschanged
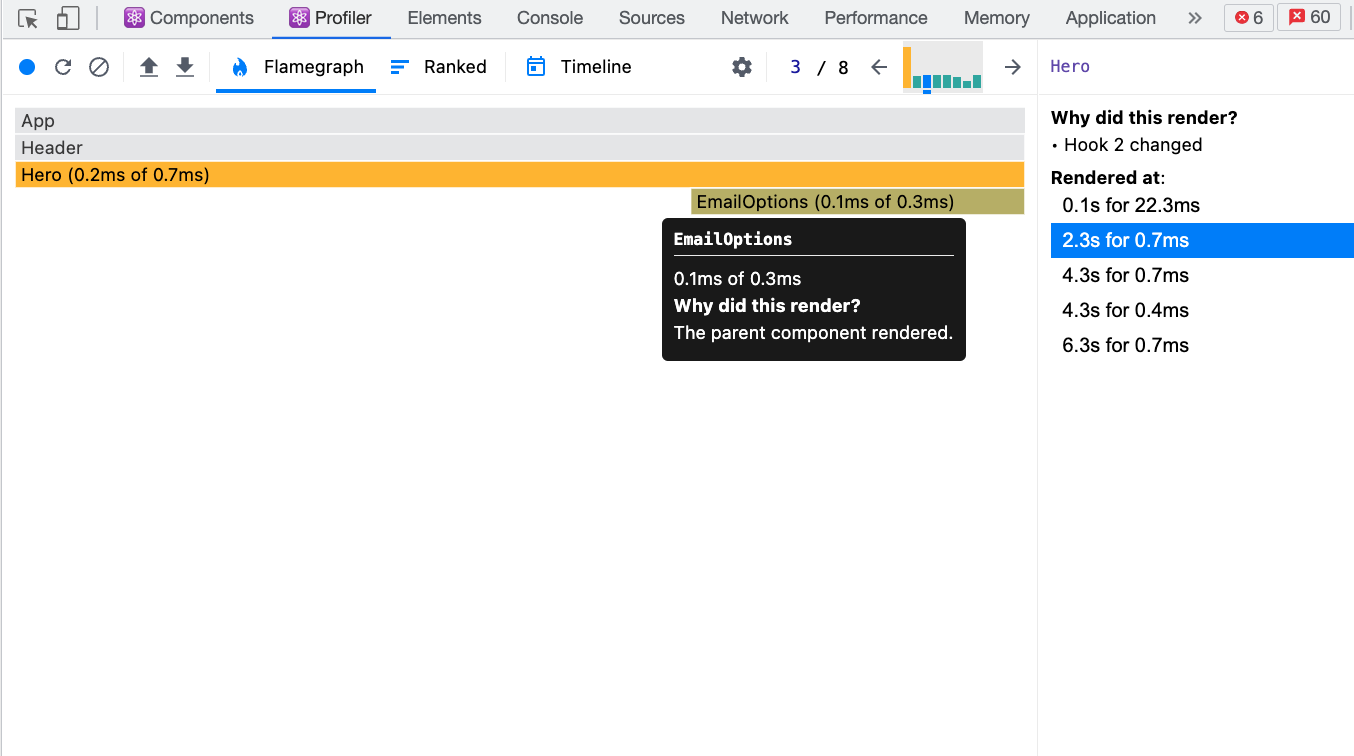
I have found that recording why a component was rendered saved me many headaches when debugging a complex React app.
Workflow debugging
There are some occasions in which none of the previously mentioned tools can help us to find a bug. In this case, I like to use a "workflow debugging" approach. This method consists in start analysing the code in the closest region to where the bug is happening, and following the flow of the code "upstream": which method is creating this section of code, what's its parent, grand-parent, etc.
Let's say a header in our app has a wrong margin. We can start by analysing the code closest to this header, looking for methods that can be altering its margin, and then analysing the code that's affecting the header at higher levels, like an inverse Matryoshka doll.
 Photo by Didssph on Unsplash
The debugging methodical process
In order to be consistent in how we proceed to find a bug, we can create our own process or framework by combining these tools and approaches. For example, when facing a bug we could:
- Start by analysing the workflow the code is following that affects a particular section of code.
- If nothing wrong is found, we could use the React Developer Tools to analyse each component closely.
- If that analysis is not delivering results, we could apply breakpoints at different sections in the code and see how the variables are being altered.
- If everything else fails, just comment out pieces of code and see what happens. Experiment.
Conclusion
We have many tools at our disposal to look for bugs, but it's not always easy to find them. I think it's very important not to feel frustrated when debugging an app, and to focus on a systematic, step by step process to analyse the code.
I'm sure I haven't covered all the techniques available for debugging a React app, so if you have one that's your favourite and that is not listed here, please share it in the comments so we can all learn from it. 😊
🗞️ NEWSLETTER - If you want to hear about my latest articles and interesting software development content, subscribe to my newsletter.
🐦 TWITTER - Follow me on Twitter.


